
Job cost variance: Separate quantity, rate and scope changes
Explain estimated-versus-actual job cost with a preserved baseline, quantity and rate calculations, and separate scope changes. Includes a worked worksheet.
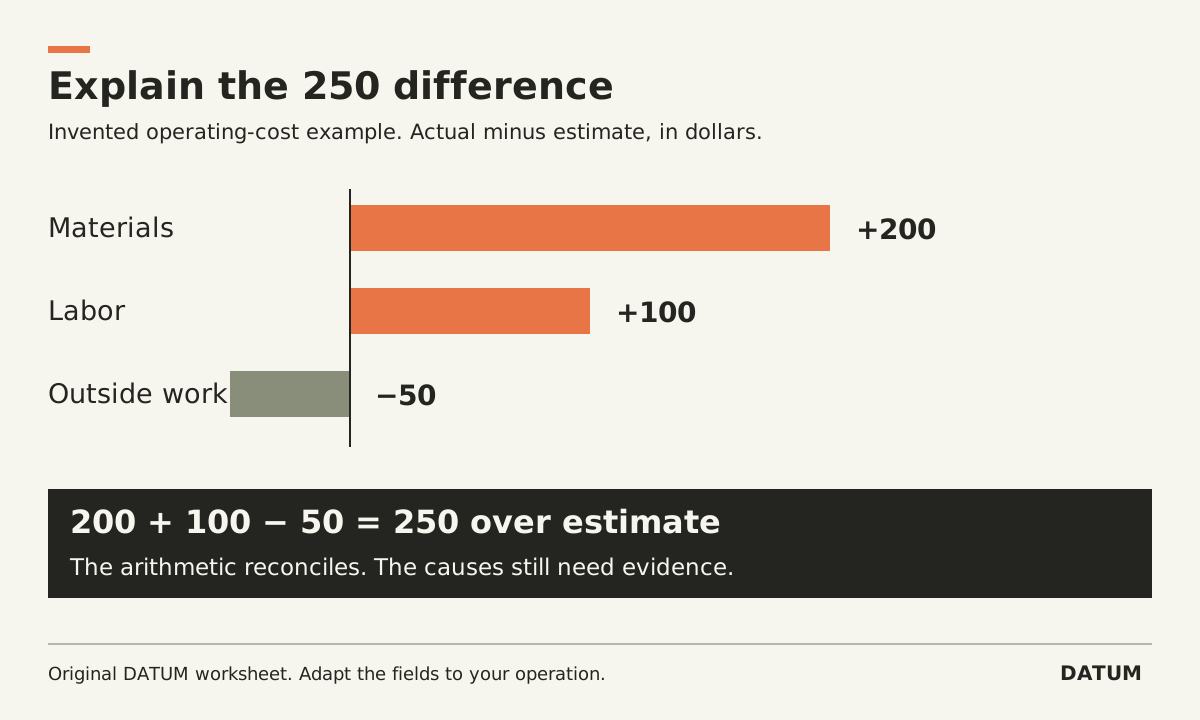
Calculate job cost variance against a named estimate for the same scope and reporting basis. Then separate quantity, rate and approved scope changes before deciding what the difference means. “Actual cost exceeded estimate” is a result to explain, not yet a cause.
Preserve the estimate before work begins. Record its version, quantities, rates, included work and assumptions. A comparison becomes unreliable if the baseline quietly changes while the job is running.
Start with a cost bridge
The following invented example uses dollars and simplified operating costs. It is not an accounting policy or a customer result.
| Category | Estimate | Actual | Actual minus estimate |
|---|---|---|---|
| Materials | $1,000 | $1,200 | +$200 |
| Labor | $800 | $900 | +$100 |
| Outside work | $400 | $350 | −$50 |
| Total | $2,200 | $2,450 | +$250 |
The total calculation is $2,450 − $2,200 = $250 over the estimate. The category differences also sum to $200 + $100 − $50 = $250. That agreement is a useful arithmetic check.
It does not prove that materials were wasted, labor was inefficient or the outside supplier performed better. Those explanations require source evidence. First confirm that every amount belongs to this job and that the actual period is complete enough for the intended comparison.
Separate a material quantity effect from a rate effect
In the example, estimated material cost is 100 units at $10 each. Actual material cost is 120 units at $10 each. Using the estimated rate to isolate the quantity effect gives:
(120 − 100) × $10 = $200 quantity effect.
The rate effect is 120 × ($10 − $10) = $0. Together they explain the $200 material difference.
If the actual rate were $11, the total actual material cost would instead be 120 × $11 = $1,320. The same bridge would show $200 of quantity effect plus 120 × ($11 − $10) = $120 of rate effect, totaling $320. This is an alternative illustration, not an additional cost in the original table.
State the decomposition convention so another person can reproduce it. This method uses the estimated rate for the quantity effect and actual quantity for the rate effect. It is a management-analysis worksheet, not a substitute for the accounting owner's required reporting method.
Ask what changed in the work
For each difference, keep the source record and the explanation separate:
| Difference | Evidence to examine | Question to resolve |
|---|---|---|
| More material consumed | Issues, returns, scrap and revised scope | Was the extra quantity required, wasted or misrecorded? |
| More labor cost | Approved time, rate basis and work performed | Did hours, rate, scope or assignment change? |
| Outside-work difference | Approved supplier scope and included records | Is the comparison complete and on the same basis? |
| Missing expected cost | Open commitments and late records | Is the cost absent or simply not recorded yet? |
An approved scope increase deserves its own bridge. Show the original estimate, approved change and revised operating baseline. Do not overwrite the original and then claim there was no variance. Conversely, do not label approved extra work as poor execution merely because it was absent from the original scope.
Check whether the software preserves the baseline you need
Odoo 19.0 distinguishes an expected manufacturing-order cost from real cost. Its documentation also states that, after the manufacturing order is completed, the MO Cost column updates to match Real Cost. If your analysis needs the original estimate, preserve that approved baseline separately rather than assuming the completed order's two columns retain it. Odoo 19.0 manufacturing-order costs
Confirm the actual Enterprise applications and release in use; an Online SaaS version or a customized report may differ. Test what your report retains before relying on it for historical comparisons.
Close one explanation at a time
Use four review states: explained by evidence, scope change awaiting reconciliation, recording problem, and unresolved. Assign an owner to each unresolved line. Avoid distributing the unexplained balance across categories simply to make the table look finished.
For a manufacturing operation, the shared BOM worksheet can help settle quantity and unit assumptions before the next estimate. Keep the reconciled variance with its baseline and source records. The value is an explanation the estimator and operating team can use on the next job, not just a red total on a dashboard.